
This July, we launched the market’s first-ever database of active adult properties. Since then, we’ve doubled our property count and more than tripled the number of MSAs represented.
Read on to see what you can access today and what to expect in 2023.
What’s New: More Properties, Income Restricted, More Rate Data
In July, we launched with 500 active adult properties from the country’s 30 largest MSAs. At the time, we defined active adult as meeting the following criteria:
- Age restriction (55+, 62+, 65+, etc.)
- Apartment structure (not single-family or manufactured)
- No commercial kitchen
- Rental only
- Market-rate only
We’ve now expanded that definition to include income-restricted units, both in dedicated properties and those that operate as hybrids (containing both market-rate and income-restricted units). Just over a quarter of the communities we’re tracking include income-restricted units.
We expect the income-restricted space to remain a prominent market segment, in part because of the growing “forgotten middle” demographic that will be unlikely to afford a move to any type of market-rate senior living community.
Of the operators we’re tracking that run the most properties (Figure 1), Enterprise is among the largest to be exclusively targeting the income-restricted market, with all 20 of its properties fully income restricted. Of the remaining top five (by property count), virtually none offer income-restricted units.
 Figure 1: The five largest operators in the active adult market today
That mix may have limited relevance to the broader industry, though, as the top five operators only account for about a fifth of all properties. That makes for a pretty fragmented market (Figure 2), with smaller operators running just over 80 percent of properties.
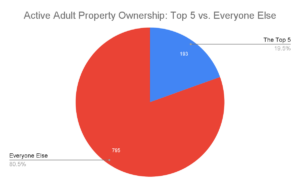
Figure 2: Breakdown of active adult market by operator size
Also of note: while some established senior living operators such as Discovery are currently operating active adult properties, the bulk of properties we’re tracking are operated by those without much historical senior living exposure. As the market matures, it will be interesting whether other established names see opportunity here.
They might: among the properties we track, average stabilized occupancy is 95 percent – exceeding IL’s approximately 85 percent occupancy rate and in line with multifamily at 96 percent.
What’s Next: More Rate & Occupancy Data, More Unit Types
Detailed rate data is available for the assets in our database, and more is coming before year end, so don’t hesitate to reach out for access.
Starting in 2023, we’ll also offer YoY rate analysis and trend forecasting.
Related: Communicating 2023’s Rate Increases to Senior Living Residents
Our definition of “active adult” will also continue evolving in 2023 as we integrate feedback from investors, operators, and developers. One change you can expect to see is the inclusion of for-sale units and manufactured homes.
Highlights from the Active Adult Database
While the strategic value of our data lies in the unit-level numbers, the aggregated data offers some compelling insights about the industry as a whole. One we’d like to highlight relates to the size of active adult communities (Figure 3).

Figure 3: Distribution of active adult communities by number of units
Most active adult communities have between 140 and 150 units. But it’s not unheard of for communities to double or even triple that figure, as the five largest illustrate:
- Jurupa Valley, CA – Country Village Apartments (BPM Real Estate): 1,256 units
- Austin, TX – ArborView Circle C Ranch (Sparrow Living): 851 units
- Largo, FL – Imperial Palms Apartments (The Goodman Group): 638 units
- San Diego, CA – The Orchard (Sunrise Management): 563 units
- Houston, TX – Westmount At Braesridge Apartments (Parawest Management Apartments: 542 units
As the market matures, we’ll be watching how unit economics play out at communities of various sizes and what kind of surrounding population density is required to sustain the larger properties.
The Active Adult Market Is Growing – and We’re Here to Help You Understand It
Interested in seeing data for competing communities? Looking to get a lay of the land in a specific region? Get in touch. As we complete our rate data buildout, we’ll prioritize any properties we have specific requests for.